Source: The Data Warehouse Toolkit: Third Edition
I assume you already understand how a data warehouse works
The Four-Step dimensional modelling process was introduced by Ralph Kimball and Margy Ross in a book called The Data Warehouse Toolkit (see The Data Warehouse Toolkit: Third Edition).
It’s a great resource to help you understand how data is modelled and to teach you the high-level concepts of how a data warehouse works across industries.
What I love about this book is that it doesn’t focus on coding and tools; you can skip the tools, but you can’t skip the fundamentals.
This post covers the four steps for designing a dimensional model:
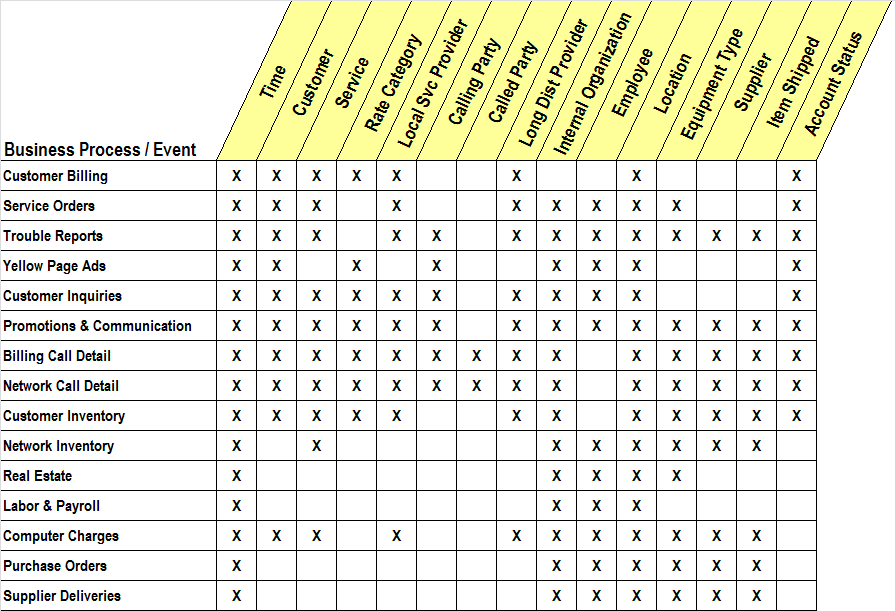
First step: select the business process
Business processes are the operational activities performed by an organization. Some examples are:
- Taking an order
- Signing up a new member
- Analyzing consumer behaviour
- Anything your company does
These business processes generate events that are translated into facts in a fact table. Most fact tables focus on the result of a single business process or event—what we’ll later call the “grain”.
Choosing the correct grain will help you design well-structured dimension tables later.
Second step: declare the grain
The grain itself, as we discussed before, is the pivotal step in dimensional design.
The grain must be declared before choosing dimensions or facts, because every candidate dimension or fact you define in the next steps must be consistent with the grain.
Imagine you have an OLTP transaction table with 1,000 rows. Each row records exactly when a customer bought some fruit. Each row corresponds to another table called Fruit that contains the fruit’s attributes. The grain here is one purchase transaction (one row), along with the associated fruit metadata.
Focus on atomic data. Yes, you can also use aggregate data and store it in a table that can be accessed easily. Read more: Aggregate Fact Table: Cube
Third step: answer 5W+1H in dimension tables
Dimensions provide the “who, what, where, when, why, and how” context for business process events. Dimension tables are often called the “soul” of a DWH because they hold lots of descriptive information that supports drill-down and more specific analysis.
Example of a dimension table:
+-------------------+----------------+
| Column Name       | Type           |
+-------------------+----------------+
| project_key       | BIGINT (PK)    |
| project_id        | VARCHAR        |
| project_name      | VARCHAR        |
| project_type      | VARCHAR        |
| faculty_name      | VARCHAR        |
| start_date        | DATE           |
| end_date          | DATE           |
| status            | VARCHAR        |
| created_timestamp | TIMESTAMP      |
+-------------------+----------------+
It explains what project_key in the fact table represents.
Last step: define the fact table
A fact table contains the numeric measures produced by an operational measurement event in the real world.
The fundamental design of a fact table focuses on the measurement activity and the grain you chose earlier. The fact keys will join to dimension tables, so you must carefully choose both facts and dimensions to achieve the best analytical results.
Example of a fact table:
+--------------------------+-------------+
| Column Name              | Type        |
+--------------------------+-------------+
| project_key              | BIGINT (FK) |
| date_key                 | INT (FK)    |
| total_budget_project     | DECIMAL     |
| student_count            | INT         |
+--------------------------+-------------+
project_key and date_key will be joined to the dimension tables project and date.
Keeping fact and dimension tables separate makes it easier to drill down and analyze data at different levels of detail.
For a comprehensive reference, see The Data Warehouse Toolkit: Third Edition.